Core Web Vitals Monitoring: Tracking LCP, INP and CLS Over Time
A Core Web Vitals check tells you where a site stands today. Core Web Vitals monitoring tells you when that changes, which template caused it and whether your fix worked. Because the numbers Google uses come from real Chrome users over 28 days, monitoring them takes a different rhythm from a lab test: weekly readings, a long trend and alerts only when a grade changes.
What Core Web Vitals Monitoring Means
Core Web Vitals monitoring is reading the same three field metrics on a schedule, keeping every reading, and acting when one crosses a line. The lines are Google's, measured at the 75th percentile of page loads, as set out on web.dev:
| Metric | Measures | Good | Poor |
|---|---|---|---|
| LCP | Loading | 2.5 s or less | Over 4 s |
| INP | Responsiveness | 200 ms or less | Over 500 ms |
| CLS | Visual stability | 0.1 or less | Over 0.25 |
Anything between the two lines is Needs Improvement. INP replaced First Input Delay as a Core Web Vital on March 12, 2024, so trends that start before that date mix two different metrics. A page passes only when all three are Good.
Monitoring asks three questions a one time check cannot: did a grade change, when did it change, and which group of pages moved. The Core Web Vitals checker guide covers the one time check and the fixes.
Field Data First: Where the Numbers Come From
Google's page experience signals use field data: the Chrome UX Report (CrUX), collected from real Chrome users who opted in. A URL or origin is included only when it is publicly discoverable and popular enough. Chrome on iOS and Android WebView apps do not contribute.
| Source | Updated | History | Level |
|---|---|---|---|
| CrUX API | Daily, about 04:00 UTC | Latest 28 days | URL, origin |
| CrUX History API | Weekly, Mondays | 25 periods, up to 40 | URL, origin |
| CrUX on BigQuery | Monthly | Since 2017 | Origin |
| Search Console report | From CrUX | URL counts by day | URL groups |
| PageSpeed Insights | Each test | Latest 28 days | URL, origin |
Both APIs are free with a Google Cloud key and allow 150 queries a minute per project, per the CrUX API docs. Each record can be split by form factor: phone, tablet or desktop. Monitor phones first; Google indexes the mobile version of a site.
Lab tools like Lighthouse are useful for finding causes, but they are a single simulated load, not the number Google reads. SEO ProCheck explains the split in field data vs lab data, and the Lighthouse monitoring guide covers the lab side.
The 28-Day Window: Why Fixes Show Up Slowly
Every CrUX number is a rolling 28 day aggregate. A fix shipped today is one day out of 28 tomorrow. The old, slow loads leave the window one day at a time:
| Days after the fix | Window after the fix | What to expect |
|---|---|---|
| 1 | 4% | No visible change |
| 7 | 25% | Small move |
| 14 | 50% | Clear move |
| 21 | 75% | Close to the new level |
| 28 | 100% | Full effect |
The History API adds a 2 day lag: its weekly point, published on Monday, covers 28 days ending the Saturday before. Search Console's Validate Fix runs on the same clock and watches for 28 days.
Two habits follow. First, read weekly, not daily; a daily reading of a 28 day average mostly shows noise from the day that left the window. Second, write down the date of every release, so a drop three weeks later can be traced to the change that caused it.
Monitor by Template, Not Only by Origin
An origin score blends every page on the site. A slow product template can sink while the home page and blog hold the average up. Pages built on one template almost always share their speed problems, so monitor a few pages of each template as well as the origin:
| Level | Needs traffic | Shows | Misses |
|---|---|---|---|
| Origin | Least | Whole site trend | Which template |
| Page group | Some | Slow template | Single pages |
| Top 10 URLs | Most | Key pages | The long tail |
Choose the most linked or most visited pages of each group: they are the ones most likely to have a URL level CrUX record. Search Console's Core Web Vitals report groups similar URLs the same way, so its groups are a good cross check. The SEO ProCheck Core Web Vitals FAQ answers the common questions about URL groups and missing data.
Alerts When a Grade Changes
An alert for every millisecond of movement gets muted within a week. Alert on grades instead: a metric that crosses Google's line is news, a metric that drifts inside its band is not.
| Alert | Trigger | Urgency |
|---|---|---|
| Good to Needs Improvement | Crosses Google's good line | This week |
| Needs Improvement to Poor | Crosses Google's poor line | Now |
| Back to Good | Returns under the good line | Confirms a fix |
| No data | Record disappears | Check traffic |
Alert per form factor and per page group, not only for the origin; that way the alert already names the template. Keep the threshold the same on every site you look after, so an alert means the same thing everywhere.
What to Check When a Grade Drops
Start with what changed around the date the trend turned, then look at the usual causes for the metric that moved:
| Metric | Look first at | Lab helper |
|---|---|---|
| LCP | Hero image, server time, render blocking | LCP breakdown |
| INP | Third party scripts, long tasks | Total Blocking Time |
| CLS | Ads, images without size, web fonts | Layout shift culprits |
Then run a lab test on one page of the affected group to find the cause, fix it, and wait out the 28 days. The metric guides go deeper: Largest Contentful Paint, Interaction to Next Paint and Cumulative Layout Shift. SEO ProCheck's complete guide to Core Web Vitals optimization covers the fixes in one place.
A Monitoring Setup That Holds Up
- Get a free CrUX API key in Google Cloud and keep it for this one job.
- Pull the history once: 40 weekly points from the History API give you about nine months of trend on day one.
- Pick the pages: the origin, the 10 most linked URLs, and 1 to 3 pages from each template.
- Read weekly, on a fixed day after Monday's History update.
- Keep every reading. The API shows 40 weeks at most; your own archive goes back as far as you started.
- Alert on grade changes per form factor and page group.
- Log releases next to the trend.
| Task | How often |
|---|---|
| Field snapshot | Weekly |
| Lab test of changed templates | Each release |
| Search Console report review | Monthly |
| Full crawl with speed checks | Monthly |
The same rhythm fits wider SEO monitoring, and the page speed monitoring guide covers the checks between releases.
Core Web Vitals Monitoring With Neova
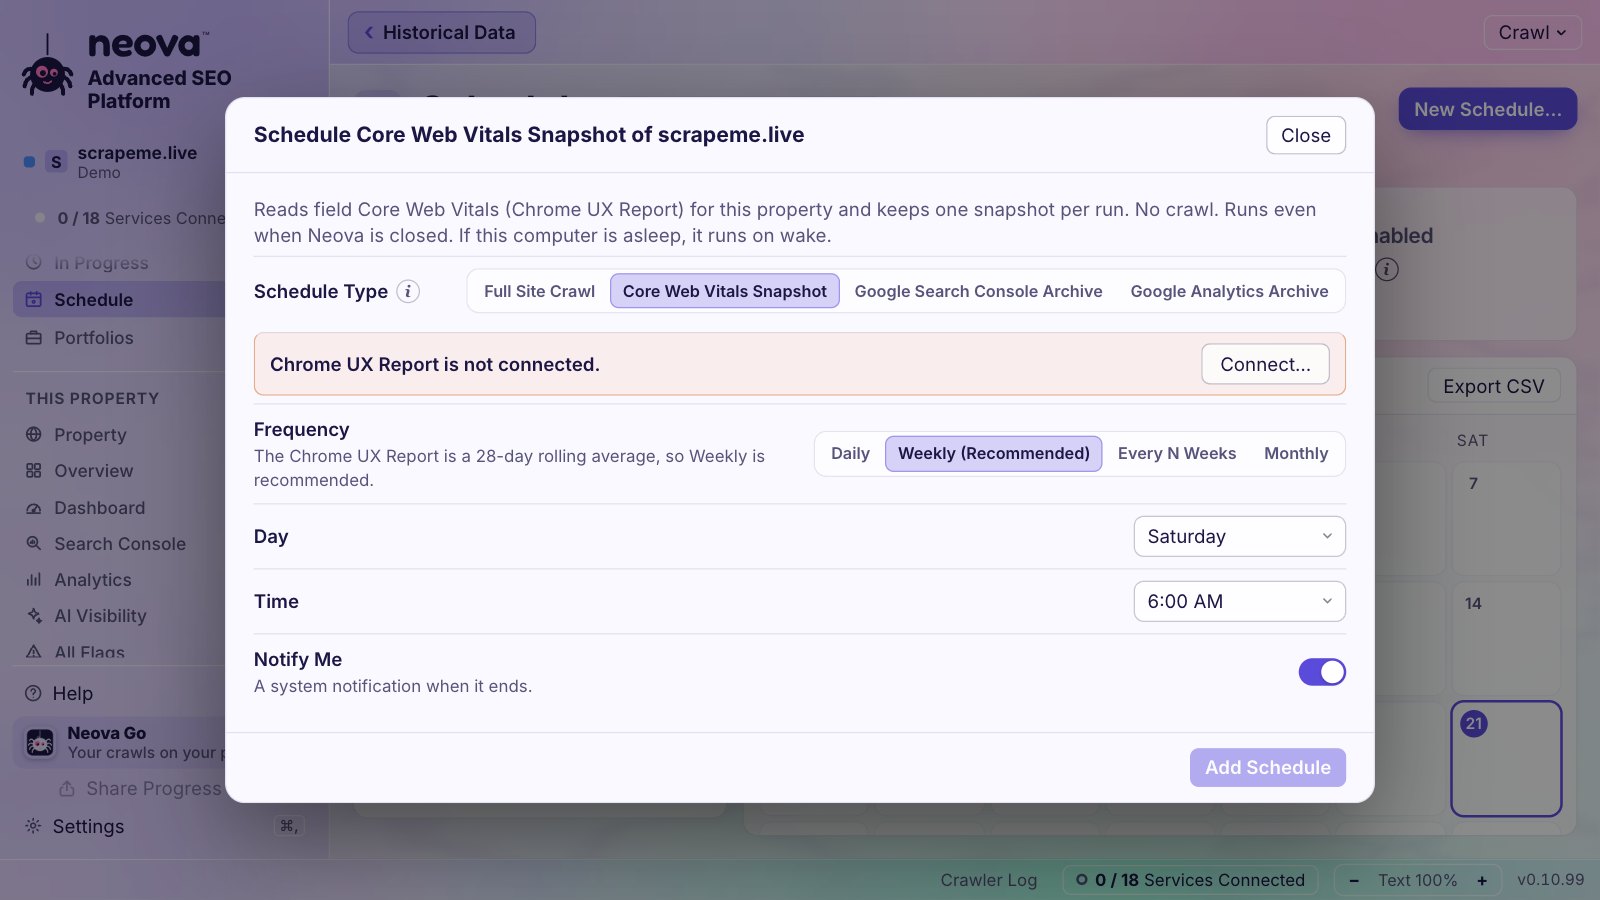
Neova reads Core Web Vitals of real visitors with your own Chrome UX Report key; Neova ships no key of its own.
- 40-week trend from the first day, one point a week, drawn with Google's good and poor lines on the Dashboard.
- Core Web Vitals by Page Group: LCP, INP and CLS of the most linked HTML pages of each page group, so a slow template shows itself. You choose 0 to 3 pages per group.
- Run Snapshot reads the origin, the most linked URLs of each page group and the 10 most linked URLs, without a crawl.
- Snapshots on a schedule: daily by default, or weekly or monthly, with the window closed. Every snapshot is kept on your computer, past the 28 days the report shows.
- Alerts when a metric gets a worse grade or comes back to Good, by Google's limits.
Alerts reach you as a system notification, in Neova Go on your phone, and in Slack or Microsoft Teams channels. If you turned on a pet in Settings, Appearance, Pets, it speaks up about crawl events such as a crawl's end with its Must Fix checks; Core Web Vitals alerts come through the channels above. Neova Go is on the Desktop plan and up.
In a crawl, the Site Audit level reads Core Web Vitals after the crawl, and the 44 Performance checks include:
- HTML Is Over 2 MB or Core Web Vitals Miss the Good Range
- CLS Is Over 0.1 in Lab or Field Data
- Server Response Time Is Slow in Lab or Field Data
- First Contentful Paint Is Slow
- LCP Image Is Not Discoverable, Not Prioritized or Lazy-Loaded
- One Third Party Runs 250 ms or More on the Main Thread
The Schedule and Monitoring help page walks through the setup. The Free plan runs every one of the 694 checks on up to 1,000 URLs a crawl; download Neova for Mac, Windows or Linux.
Questions
How often should I check Core Web Vitals?
Weekly. The Chrome UX Report is a 28 day rolling average, so daily readings change very little. The History API publishes a new weekly point every Monday.
How long does a Core Web Vitals fix take to show?
Up to 28 days. The fix enters the rolling window one day at a time: about half the window reflects it after 14 days and all of it after 28. Search Console's Validate Fix also watches for 28 days.
Why does my page have no Core Web Vitals data?
The Chrome UX Report only includes URLs and origins that are publicly discoverable and have enough Chrome visits. Low traffic pages often have no URL level record; monitor the origin and the busiest pages of each template instead.
Should I monitor Lighthouse scores or field data?
Monitor field data for the grade Google uses, and use Lighthouse to find causes and to test a release before real users see it. They answer different questions.
What should a Core Web Vitals alert be based on?
A grade change: a metric crossing Google's good or poor line at the 75th percentile, per form factor and page group. Small moves inside a band are noise.