Lighthouse Monitoring: Scheduled Lab Runs, Variance and Limits
Lighthouse is the fastest way to see why a page is slow, and running it on a schedule turns it into an early warning for every release. It is also easy to misread: one run is noisy, the score is not what Google ranks on, and some things users feel never show in a lab. This guide covers how to monitor with Lighthouse and where field data has to take over.
What Lighthouse Monitoring Is
Lighthouse loads a page in Chrome under fixed, simulated conditions and reports timings, a Performance score and a list of audits. Lighthouse monitoring is running that test on the same pages, with the same settings, on a schedule or on every release, and keeping the results as a trend.
By default a mobile run simulates a mid tier phone on a slow connection, per the throttling docs:
| Setting | Mobile | Desktop |
|---|---|---|
| Round trip time | 150 ms | 40 ms |
| Throughput | 1.6 Mbps | 10 Mbps |
| CPU slowdown | 4x | 1x |
| Method | Simulated | Simulated |
Keep these settings fixed for the life of a trend. A switch from mobile to desktop, or from simulated to DevTools throttling, starts a new trend.
Lab vs Field: What Each Can Tell You
Lighthouse is lab data: one load, one device profile, one location. Field data, from the Chrome UX Report, is what real Chrome users experienced over 28 days. They answer different questions:
| Question | Lighthouse | Field data |
|---|---|---|
| Why is this page slow? | ✓ | – |
| Did this release make it slower? | ✓ | ◐ |
| Test before users see it | ✓ | – |
| Pages with little traffic | ✓ | – |
| INP of real interactions | – | ✓ |
| Real devices and networks | – | ✓ |
| Google's Core Web Vitals grade | – | ✓ |
So monitor both. Lighthouse catches a change within minutes; field data confirms weeks later whether visitors felt it. SEO ProCheck's field data vs lab data explains why the two often disagree, and the Core Web Vitals monitoring guide covers the field side.
Why Lighthouse Scores Move Between Runs
Run Lighthouse twice on the same page and the score will differ. The Lighthouse team lists the causes in its variability guide:
| Source | Effect | Simulated throttling helps |
|---|---|---|
| Page changes, ads, A/B tests | High | – |
| Local network | High | ✓ |
| Test machine hardware | High | ◐ |
| Other apps and extensions | High | ◐ |
| Distance to the server | Medium | ✓ |
| Browser itself | Medium | ◐ |
| Server load | Low | – |
The fix is aggregation. In the same guide's words, the median Lighthouse score of 5 runs is twice as stable as 1 run. Use at least 2 dedicated CPU cores and 2 GB of memory (4 cores and 4 to 8 GB recommended), and never run two Lighthouse tests at once on one machine.
The Performance Score and Its Weights
The Performance score is a weighted blend of five lab metrics, per Lighthouse performance scoring (Lighthouse 10 and later):
| Metric | Weight | Field equivalent |
|---|---|---|
| Total Blocking Time | 30% | INP, loosely |
| Largest Contentful Paint | 25% | LCP |
| Cumulative Layout Shift | 25% | CLS, load only |
| First Contentful Paint | 10% | FCP |
| Speed Index | 10% | None |
Scores of 90 to 100 are green, 50 to 89 orange and 0 to 49 red. Because one metric carries 30%, a single heavy script can move the score 10 points while LCP and CLS stay put. Monitor the five metrics, not only the score; the score tells you something moved, the metrics tell you what. SEO ProCheck's technical SEO guide to Lighthouse performance metrics walks through each one.
What Lighthouse Cannot Tell You
- INP. A page load test has no real clicks or taps. Total Blocking Time is a useful proxy, and web.dev is clear that it is not a substitute for INP.
- Your users' devices. A 4x CPU slowdown on a fast laptop is an estimate of a mid tier phone, not a measurement of your visitors' phones.
- Repeat visits. Each run starts with an empty cache, so the effect of caching on returning visitors is not shown.
- Layout shifts after load. Lab CLS covers the load; shifts from scrolling, late ads and infinite lists show only in the field.
- Your ranking. Google's page experience signals use Core Web Vitals from field data. A Lighthouse score of 100 does not change a field grade that real visits made Poor.
- Logged in or personalized pages, unless you script the login.
None of this makes Lighthouse less useful. It makes it a diagnostic and a release gate, not a scoreboard.
Setting Up Scheduled Lighthouse Runs
Lighthouse takes about 30 seconds a test on suitable hardware, per the variability guide. That adds up fast, so sample instead of testing every page. We found this on our own site: Neova's crawl of seoprocheck.com on October 17, 2026 found 4,561 HTML pages answering 200.
| Plan for 4,561 pages | Tests | Time at 30 s |
|---|---|---|
| Every page, 1 run | 4,561 | About 38 h |
| Every page, 5 runs | 22,805 | About 190 h |
| 10 templates, 5 runs | 50 | About 25 min |
Pages on one template share their speed problems, so one or two pages per template, run five times each, find almost everything a full run would. A setup that holds up:
- Pick 1 or 2 pages per template, plus the home page.
- Fix the settings: device, throttling method, location, machine.
- Run 5 times and keep the median run.
- Keep every result with the date and the release it followed.
- Alert on a metric crossing a budget, not on a score wobble.
Lighthouse CI runs this on every commit with assertions per metric. The page speed monitoring guide covers budgets and release checks.
Reading a Lighthouse Trend Without Fooling Yourself
| Rule | Why |
|---|---|
| Compare medians, never single runs | One run is noise |
| Same settings for the whole trend | Otherwise a new trend |
| Note Lighthouse version upgrades | Scoring can change |
| Treat moves under 5 points as noise | Normal run spread |
| Check metrics before the score | Score blends five |
| Confirm in field data after 4 weeks | Users decide the grade |
The 5 point line is a rule of thumb, not a published number; set your own from the spread of your first ten medians. If a template's score falls and its field LCP holds, the lab caught something users have not felt yet: the best time to fix it.
Lighthouse Monitoring With Neova
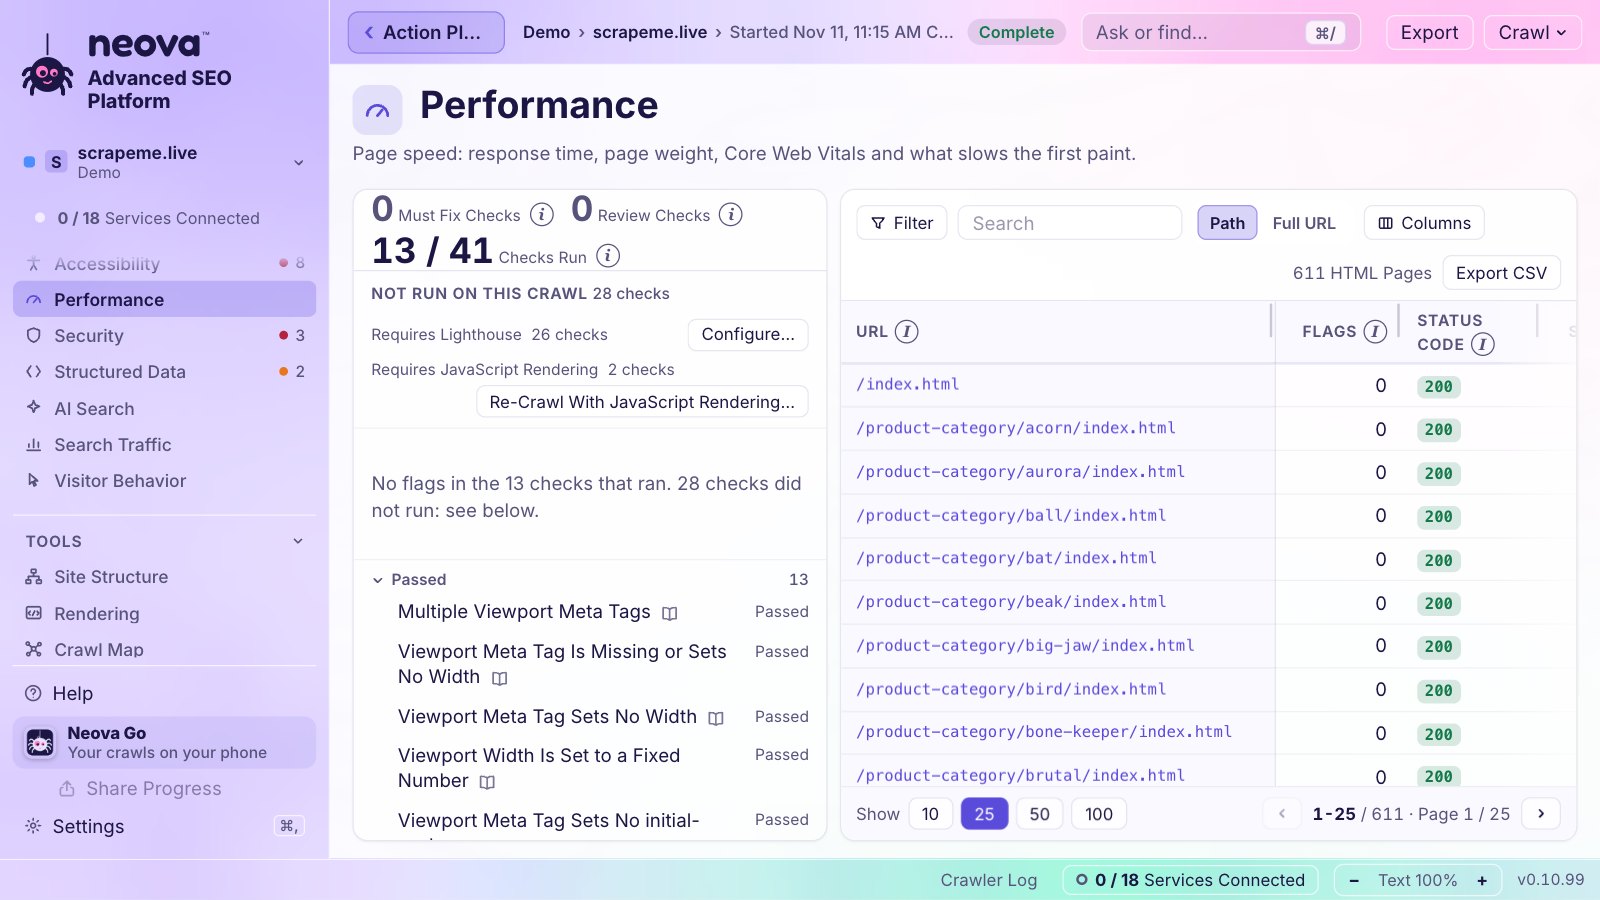
Neova runs Lighthouse in New Crawl: Lighthouse per Page Group runs lab checks on one HTML page per page group during the crawl, so every template is tested without testing every page. Turn it on under New Crawl, Speed and Rendering, Lighthouse. Compare Crawls then shows which flags are new and which resolved since the last crawl.
For the field side, Neova reads Core Web Vitals of real visitors with your own Chrome UX Report key: a 40-week trend from the first day, a view per page group, snapshots on a schedule and alerts when a grade changes, sent as system notifications, to Neova Go on your phone and to Slack or Microsoft Teams. Grade alerts come from field data, not from Lighthouse runs.
Lighthouse checks among the 44 Performance checks:
- Lighthouse Performance Score Is Below 50
- Render-Blocking Requests Delay the First Paint
- JavaScript Execution Time Is Over 1.3 Seconds
- Main-Thread Work Is Over 2 Seconds
- LCP Image Is Lazy-Loaded
- Speed Index Is Slow
- JavaScript File Is Over the Lighthouse Line for Unused Code
- CLS Is Over 0.1 in Lab or Field Data, lab or field
The Free plan runs all 694 checks on up to 1,000 URLs a crawl. See Features or download Neova.
Questions
Is Lighthouse good for monitoring page speed?
Yes, as a lab test: it catches regressions within minutes and explains their cause. Pair it with field data from the Chrome UX Report, which is what Google's Core Web Vitals grade is based on.
Why is my Lighthouse score different every time?
Network, test machine, other running apps, ads and A/B tests all change between runs. Run 5 times and use the median, which the Lighthouse team says is twice as stable as one run.
Does the Lighthouse score affect rankings?
Not directly. Google's page experience signals use Core Web Vitals from real users. Lighthouse helps you improve those, but the score itself is a lab measure.
Can Lighthouse measure INP?
No, a page load test has no real interactions. Total Blocking Time is the lab proxy, but INP comes from field data.
How many pages should I test with Lighthouse?
One or two per template plus the home page, run 5 times each. Pages built on one template share their speed problems, so testing every page adds time but little new information.