Bulk Page Speed Test: How to Check Page Speed for a Whole Site
PageSpeed Insights tests one URL at a time. That is fine for a home page and useless for a site with thousands of pages. A bulk page speed test checks many URLs in one go, but the trick is not testing every page: it is testing the right page for every template and reading real-user data where it exists. Here is how to do it with free tools, and with a crawler.
What a Bulk Page Speed Test Is For
A bulk page speed test measures Core Web Vitals and lab metrics for a list of URLs instead of one. You run it to answer three questions: which templates are slow, which metric fails on each, and whether last month's fix worked.
Speed problems belong to templates, not pages. A product template that loads a 900 KB hero image does it on every product. So the useful output of a bulk test is a list of page groups with their numbers, not 5,000 rows of scores.
We found this on our own site: our Neova crawl of seoprocheck.com on October 17, 2026 returned 4,561 HTML pages that answered 200. Testing each one in Lighthouse would mean 4,561 full page loads on a throttled phone. Most of those pages share a handful of templates, so one page per template tells you nearly everything the other 4,500 would.
The Numbers to Collect for Every Template
| Metric | Kind | Good | Poor | Source |
|---|---|---|---|---|
| LCP | Field and lab | ≤ 2.5 s | > 4.0 s | web.dev |
| INP | Field only | ≤ 200 ms | > 500 ms | web.dev |
| CLS | Field and lab | ≤ 0.1 | > 0.25 | web.dev |
| TTFB | Field and lab | ≤ 0.8 s | > 1.8 s | web.dev |
| FCP | Field and lab | ≤ 1.8 s | > 3.0 s | web.dev |
LCP, INP and CLS are the Core Web Vitals. TTFB and FCP are not, but they explain a slow LCP: if the first byte takes 1.5 seconds, no image fix will get LCP under 2.5. Field thresholds apply to the 75th percentile of real visits over 28 days. Lab tests report Total Blocking Time instead of INP. Each metric has its own guide: LCP, INP and CLS.
Field Data vs Lab Data in Bulk
| Field data (CrUX) | Lab data (Lighthouse) | |
|---|---|---|
| Cost per URL | One API call | One full page load |
| Speed in bulk | Seconds per hundred | Minutes per hundred |
| Low-traffic URLs | Often no data | Always works |
| INP | ✓ | – TBT instead |
| Says why | – | ✓ |
| Used by Google | ✓ | – |
The two kinds of data do different jobs in a bulk test. Field data is cheap and is what Google judges, so pull it for as many URLs as have it. Lab data is slow and noisy but tells you what to fix, so run it on one or two URLs per template. Many URLs on a small site have no field data at all; Google then falls back to the whole origin. SEO ProCheck explains what to do when there is no Core Web Vitals field data.
Free Ways to Run a Bulk Page Speed Test
| Method | Field | Lab | Needs | Runs on |
|---|---|---|---|---|
| Chrome UX Report API | ✓ | – | Free API key | Any script |
| PageSpeed Insights API | ✓ | ✓ | Free API key | Any script |
| Lighthouse CLI | – | ✓ | Node and Chrome | |
| Search Console Core Web Vitals report | ✓ | – | Verified site | |
| A crawler with Lighthouse | ◐ | ✓ | A crawl |
Each does something well. The CrUX API is the field data itself, free, at up to 150 queries a minute per Google Cloud project, updated daily around 04:00 UTC. The PageSpeed Insights API returns field data and a full Lighthouse run in one call, with a daily quota you can see in the Google Cloud console. The Lighthouse CLI runs on your own machine, including against staging sites the public tools cannot reach. Search Console groups similar URLs for you, which is a template view for free.
Bulk Testing With the APIs and Lighthouse
Field data for one URL from the CrUX API, phones only:
curl -s "https://chromeuxreport.googleapis.com/v1/records:queryRecord?key=YOUR_KEY" \
  -H "Content-Type: application/json" \
  -d '{"url": "https://www.example.com/products/blue-shoe/", "formFactor": "PHONE"}'
Swap url for origin to get the whole site. A 404 answer means the URL does not have enough visits to be in the report. Loop over a list of URLs and stay under the per-minute limit.
Lab data for a list of URLs with the Lighthouse CLI, one JSON report each:
while read url; do
  name=$(echo "$url" | md5)
  npx lighthouse "$url" --only-categories=performance \
    --output=json --output-path="./reports/$name.json" \
    --chrome-flags="--headless"
done < urls.txt
On Linux use md5sum instead of md5. Run each URL three times and keep the median: lab scores move by several points between runs because of network and CPU noise. Lighthouse throttles to a mid-range phone by default; add --preset=desktop for a desktop run. SEO ProCheck's technical SEO guide to Lighthouse performance metrics explains each number in the report.
A Bulk Page Speed Test Plan That Scales
- Group URLs by template: home, category, product, article, landing page, search results. Use the URL path or a crawler's page groups.
- Pick the test pages. For field data, the most visited or most linked URLs of each group, since they are the likeliest to be in CrUX. For lab data, one or two typical pages per group.
- Pull field data first for the picked URLs and the origin, phone and desktop.
- Run Lighthouse on the lab pages, three runs each, median kept.
- Build one row per template with LCP, INP, CLS, TTFB and the main Lighthouse findings.
- Fix the worst template with the most traffic first.
- Repeat on a schedule. CrUX is a rolling 28 days, so a fix takes weeks to show fully. Keep every reading to see the trend.
| Template | LCP | INP | CLS | Verdict |
|---|---|---|---|---|
| Home | 1.9 s | 150 ms | 0.02 | ✓ |
| Product | 3.4 s | 180 ms | 0.18 | – LCP, CLS |
| Article | 2.2 s | 320 ms | 0.04 | ◐ INP |
| Search results | no data | no data | no data | Lab only |
The table above is an example of the output to aim for, not real data: four rows that tell a team exactly where to work. Speed is one step of the technical SEO audit checklist.
Run a Bulk Page Speed Test With Neova
Neova does the grouping for you. It groups the HTML pages of a crawl by template, read from their HTML, then:
- Lighthouse per Page Group runs lab checks on one HTML page per page group during the crawl, when Lighthouse is turned on in New Crawl.
- Core Web Vitals by Page Group shows LCP, INP and CLS from the Chrome UX Report for the most linked HTML pages of each group, with your free API key.
- Run Snapshot reads the origin, the most linked URLs of each group and the 10 most linked URLs, without a crawl, and can run daily, weekly or monthly. Every snapshot is kept on your computer.
- Response Time Live shows the median, 9 in 10 and slowest response times while the crawl runs, with the 10 slowest pages.
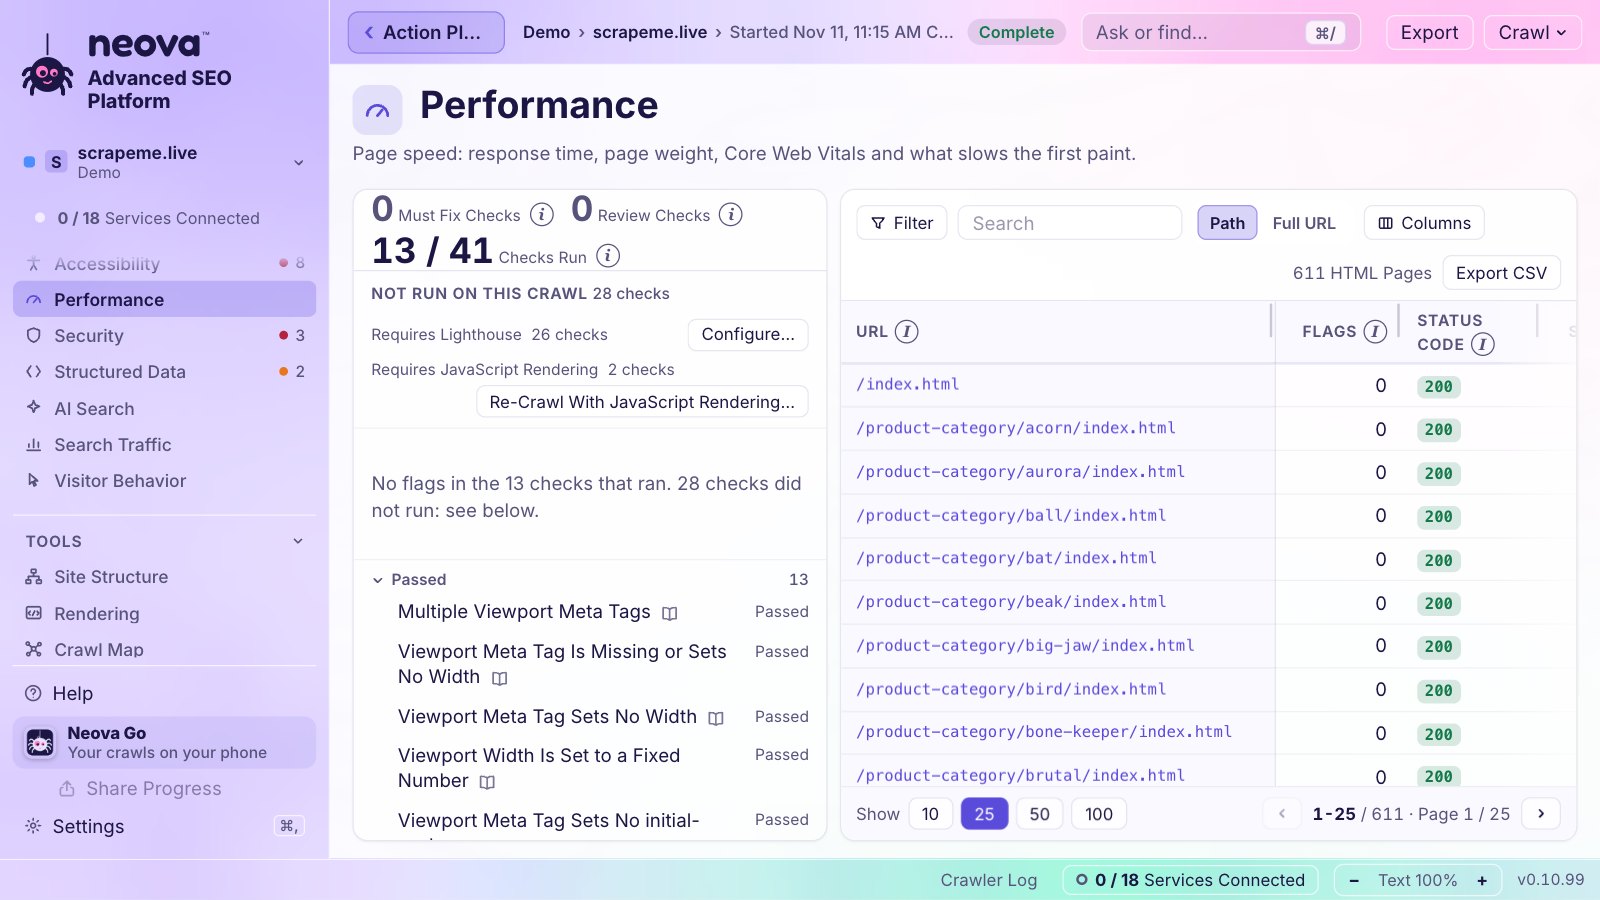
The checks that turn the numbers into findings include:
- HTML Is Over 2 MB or Core Web Vitals Miss the Good Range
- Server Response Time Is Slow in Lab or Field Data
- First Contentful Paint Is Slow and Speed Index Is Slow
- CLS Is Over 0.1 in Lab or Field Data
- Network Payload Is Over the Lighthouse Passing Line
- Render-Blocking Requests Delay the First Paint
- Lighthouse Performance Score Is Below 50, as a lab diagnostic
Every check runs on every plan; the Free plan crawls up to 1,000 URLs with all of them, on . See Features or download Neova. For a single URL, the Core Web Vitals checker guide compares the one-page tools.
Questions
How do I test page speed for many URLs at once?
Pull field data for each URL from the Chrome UX Report API or the PageSpeed Insights API, and run Lighthouse from the command line or a crawler on one or two pages per template. Group the results by template.
Is there a limit on the PageSpeed Insights API?
Yes. It has a daily quota and a per-minute limit per Google Cloud project, shown on the API's quota page in the Cloud console. The Chrome UX Report API allows 150 queries a minute per project, free.
Why do some URLs have no field data?
The Chrome UX Report only includes URLs with enough visits from Chrome users who share usage statistics. Low-traffic pages return no data; use the origin's data and lab tests for them.
Do I need to test every page?
No. Pages built from the same template usually share the same speed problems. Test the most visited pages of each template for field data and one or two typical pages per template in the lab.
Why do Lighthouse scores change between runs?
Network timing, CPU load on the testing machine and third-party scripts vary from run to run. Run each URL three times and keep the median, on the same machine and settings.