Core Web Vitals Checker: Measure LCP, INP and CLS Across Your Site
Core Web Vitals are Google's three measures of how a page feels to the people using it: how fast the main content appears, how quickly the page answers a tap or click, and how much the layout jumps around. A Core Web Vitals checker reports them, but which numbers it reports matters. Real visitors and a test in a lab often disagree, and Google judges the real visitors.
The Three Core Web Vitals and Their Thresholds
| Metric | Measures | Good | Needs Improvement | Poor |
|---|---|---|---|---|
| Largest Contentful Paint (LCP) | Main content render time | ≤ 2.5 s | 2.5 to 4 s | > 4 s |
| Interaction to Next Paint (INP) | Response to every interaction | ≤ 200 ms | 200 to 500 ms | > 500 ms |
| Cumulative Layout Shift (CLS) | Unexpected layout movement | ≤ 0.1 | 0.1 to 0.25 | > 0.25 |
INP replaced First Input Delay as a Core Web Vital on March 12, 2024. FID measured only the delay before the first interaction; INP looks at all of them. The definitions and thresholds are on web.dev, and SEO ProCheck keeps a short Core Web Vitals glossary entry.
How Pages Are Assessed: the 75th Percentile
A page does not have one LCP. Every visit has its own, depending on the device, the network and what was cached. Google takes the 75th percentile of real visits over the last 28 days: if three in four visits are good, the metric is good. Phones and desktops are assessed separately.
PageSpeed Insights passes the assessment when the 75th percentile of LCP, INP and CLS are all good. When a URL has too few visits in the Chrome UX Report, it shows data for the whole origin instead, and when the origin has too few as well, there is no real-user data at all. Small sites and new pages often land there.
Field Data vs Lab Data
Every Core Web Vitals checker reports one of two kinds of data, or both:
| Field data | Lab data | |
|---|---|---|
| Source | Real Chrome users (CrUX) | One simulated load |
| Period | 28 days | 1 run |
| Devices | Every visitor's | Throttled mid-range phone |
| INP | ✓ | – (Total Blocking Time instead) |
| Says why | – | ✓ |
| Used by Google | ✓ | – |
| Low-traffic pages | Often no data | Always works |
The two disagree often. web.dev's article on lab and field differences explains why: caching, real devices, logged-in states and what people actually do on the page. SEO ProCheck's field vs lab data guide explains CrUX in more depth. Use field data to decide whether there is a problem, and lab data to find the cause.
Free Core Web Vitals Checkers and What Each Does Well
| Tool | Field | Lab | Pages | Runs on |
|---|---|---|---|---|
| PageSpeed Insights | ✓ | ✓ | 1 URL and its origin | |
| Search Console Core Web Vitals report | ✓ | – | Your site, grouped | |
| Lighthouse in Chrome DevTools | – | ✓ | 1 URL | |
| Chrome UX Report API | ✓ | – | Any URL or origin | API key |
| Neova | ✓ | ✓ | Every page group |
PageSpeed Insights is the quickest way to see both kinds of data for one page. Search Console groups similar URLs and marks each group Good, Needs Improvement or Poor. Lighthouse runs on your own machine or a staging site, with a full list of what to fix. The CrUX API is the field data itself, free with an API key. Google's Core Web Vitals page for Search points site owners to the Search Console report first.
Checking Core Web Vitals Across a Whole Site
Speed problems usually belong to templates, not pages. A product template that loads a large hero image late, or a blog template whose ads push content down, affects every page built from it. Checking pages one at a time hides that pattern.
- Group pages by template: home, categories, products, articles, landing pages.
- Read field data per group from the most visited or most linked pages of each, since those are the ones most likely to have CrUX data.
- Run Lighthouse on one page per group to get a diagnosis that stands for the template.
- Fix the worst group first, weighted by how much traffic it gets.
- Keep a history. CrUX shows a rolling 28 days, so a fix takes weeks to show fully. Saving readings over time is the only way to see the trend.
Speed is one part of the technical SEO audit checklist. If pages build their content with scripts, the JavaScript SEO crawler guide covers the rendering side.
What Usually Fixes Each Metric
- LCP: a fast server response, the LCP image in the initial HTML rather than added by script, fetchpriority=high on it and no loading=lazy, and fewer render-blocking style sheets and scripts.
- INP: less JavaScript running on the main thread, long tasks broken up, third-party scripts loaded later or removed, and event handlers that do the visible update first and the rest after.
- CLS: width and height on images and video, space reserved for ads and embeds, and web fonts that swap without reflowing the text.
A common LCP pattern looks like this:
<img src="https://neova.app/hero.webp" width="1200" height="600"
     fetchpriority="high" alt="Trail running shoes on a rocky path">
Core Web Vitals and Rankings
Google says it highly recommends good Core Web Vitals for success in Search, and that they line up with what its ranking systems reward. It does not say good scores will lift a page above more relevant content. In practice, relevance comes first and page experience helps between pages that are otherwise close. The clearer gain is for visitors: pages that load and respond quickly lose fewer of them.
The Lighthouse Performance score is not a Core Web Vital. It is a lab summary that is useful for comparing runs, but Google does not use it, and a page can score well in the lab and still fail on real phones.
Check Core Web Vitals With Neova
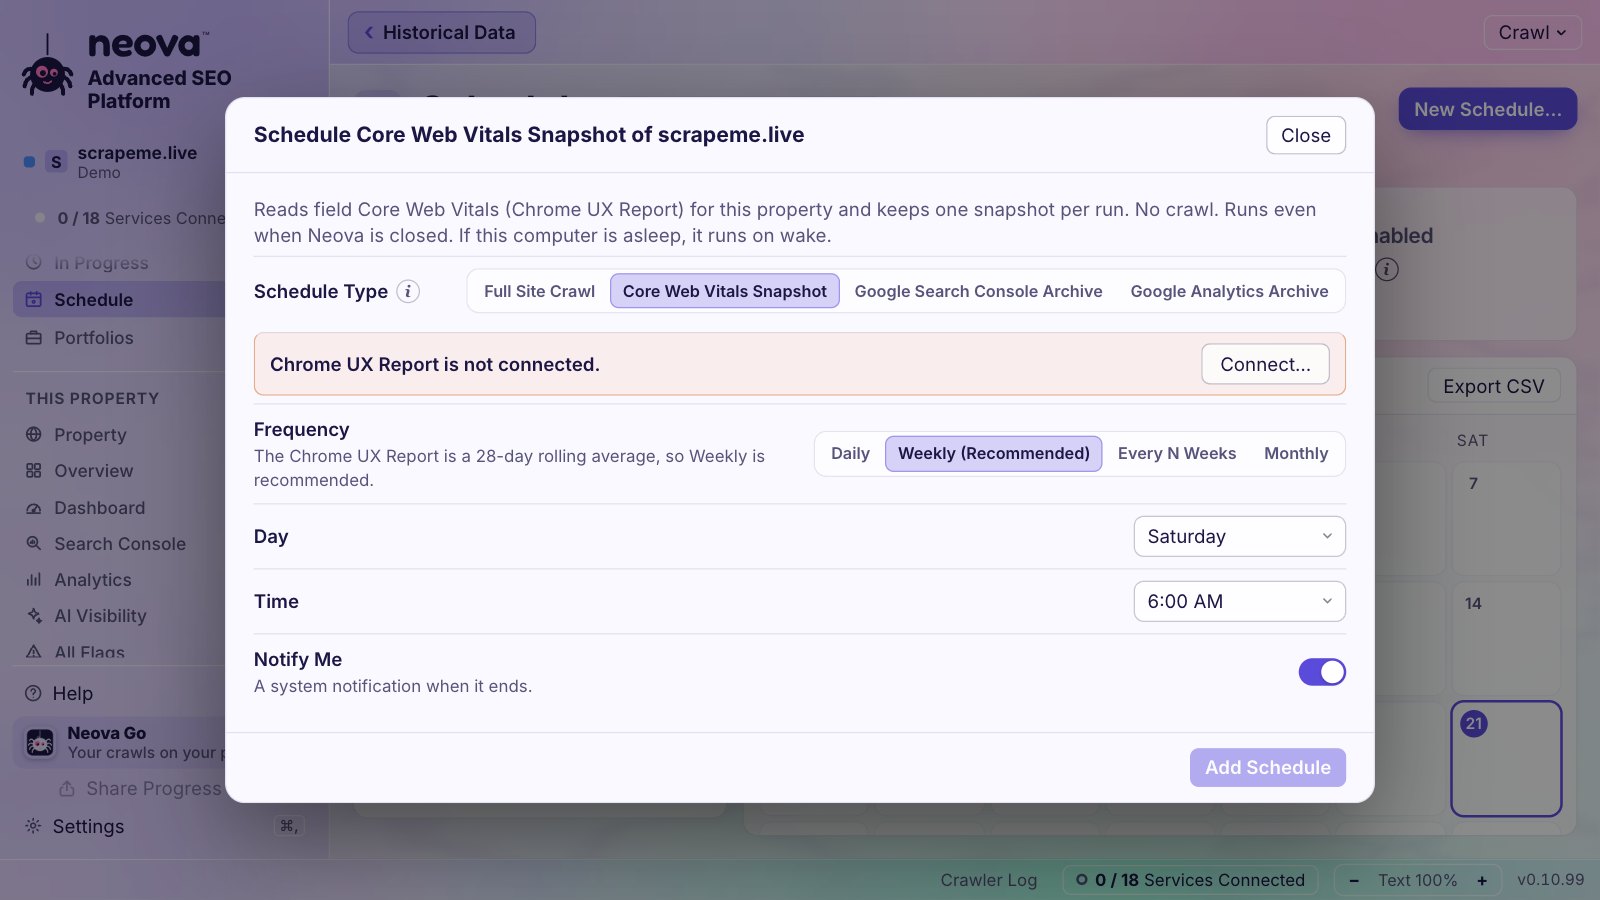
Neova reads both kinds of data. With your free Chrome UX Report API key, Real-User Core Web Vitals shows the LCP, INP and CLS of real Chrome users on phones at the 75th percentile, with a 40-week trend from the first day, a view per page group, snapshots on a schedule without a crawl, and alerts when a metric changes grade. Every snapshot is kept on your computer, past the 28 days CrUX shows. In New Crawl, Lighthouse runs lab checks on one HTML page per page group. Some of the checks:
- HTML Is Over 2 MB or Core Web Vitals Miss the Good Range, field data first, lab data when there is none
- CLS Is Over 0.1 in Lab or Field Data
- Server Response Time Is Slow in Lab or Field Data
- LCP Image Is Not Discoverable, Not Prioritized or Lazy-Loaded
- Render-Blocking Requests Delay the First Paint
- Main-Thread Work Is Over 2 Seconds and One Third Party Runs 250 ms or More on the Main Thread, common causes of slow INP
- Lighthouse Performance Score Is Below 50, as a lab diagnostic only
See Features or download Neova; the Free plan runs every check on up to 1,000 URLs.
Questions
What is a Core Web Vitals checker?
A tool that reports a page's Largest Contentful Paint, Interaction to Next Paint and Cumulative Layout Shift, from real-user field data, a lab test such as Lighthouse, or both.
What are good Core Web Vitals scores?
LCP of 2.5 seconds or less, INP of 200 milliseconds or less and CLS of 0.1 or less, measured at the 75th percentile of real visits, for phones and desktops separately.
Why do PageSpeed Insights lab and field numbers differ?
The lab number is one simulated load on a throttled phone. The field number covers 28 days of real Chrome visits on many devices and networks, with caching and real interactions. Google uses the field data.
Why does my page have no Core Web Vitals data?
The Chrome UX Report only publishes data for URLs and origins with enough Chrome visits. Pages with little traffic fall back to the origin, and small sites may have none. Lab tests still work for them.
Is INP the same as FID?
No. INP replaced First Input Delay in March 2024. FID measured only the delay before the first interaction was handled; INP measures the time to the next paint for all interactions during a visit.