Page Speed Monitoring: What to Watch, Thresholds and Regressions
Sites rarely get slow all at once. A new tag manager rule, a bigger hero image, a plugin update: each costs a few hundred milliseconds, and nobody notices until a grade turns red. Page speed monitoring is the habit of measuring the same pages the same way on a schedule, with thresholds set in advance, so a slowdown is caught the week it ships.
What Page Speed Monitoring Is
A speed test answers one question once. Page speed monitoring repeats it with three rules: the same pages, the same settings, and a written threshold for each number. Without the first two, every difference may be the test, not the site. Without the third, nobody knows when to act.
| Speed test | Monitoring | |
|---|---|---|
| Pages | Any | Fixed list |
| Settings | Default | Fixed, written down |
| Runs | Once | On a schedule |
| Result | A score | A trend |
| Action | Read it | Alert at a threshold |
For testing many pages once, the bulk page speed test guide is the better starting point. This guide is about what happens after.
The Numbers Worth Watching
Watch a few numbers well instead of every number in a report. These have published thresholds from web.dev and the TTFB guide, all at the 75th percentile in field data:
| Number | Good | Poor | Core Web Vital |
|---|---|---|---|
| TTFB | 0.8 s or less | Over 1.8 s | – |
| FCP | 1.8 s or less | Over 3 s | – |
| LCP | 2.5 s or less | Over 4 s | ✓ |
| INP | 200 ms or less | Over 500 ms | ✓ |
| CLS | 0.1 or less | Over 0.25 | ✓ |
TTFB is not a Core Web Vital, but every millisecond of it is added to FCP and LCP, which makes it the earliest warning that the server or cache changed. SEO ProCheck's TTFB glossary entry explains what it includes. Two lab numbers are worth adding: total page weight and main thread time, because they move as soon as a heavier script or image ships.
Field and Lab: Two Kinds of Monitoring
Speed can be measured on real visits or in a controlled test. Monitoring needs both, for different jobs:
| Field | Lab | |
|---|---|---|
| Source | Real Chrome users | One simulated load |
| Example | Chrome UX Report | Lighthouse |
| Delay | Up to 28 days | Minutes |
| Measures INP | ✓ | – |
| Before release | – | ✓ |
| Explains the cause | ◐ | ✓ |
| What Google uses | ✓ | – |
Field data tells you whether visitors are affected; lab data tells you why and catches a change before it reaches them. The Core Web Vitals monitoring guide covers the field side in depth and the Lighthouse monitoring guide covers the lab side.
How Often to Check
Match the rhythm to how fast each source can change. Checking field data every hour only shows the same 28 day average again:
| What | How often | Why |
|---|---|---|
| Lab test of key templates | Each release | Catches regressions first |
| Server response, key pages | Daily | Cache and hosting change fast |
| Field Core Web Vitals | Weekly | 28 day average |
| Full crawl with speed checks | Monthly | Finds new slow pages |
| Search Console report | Monthly | Google grouped view |
Test from the same place, on the same device profile, at a quiet hour for the server. A test that runs while a backup job runs will report the backup.
Thresholds and Performance Budgets
A performance budget is a limit the team agrees on before work starts: a number per template that a release may not cross. Google's guide to performance budgets splits them into timing limits, size limits and rule based limits such as a Lighthouse score. An example budget for a product template:
| Budget | Limit | Kind |
|---|---|---|
| LCP, lab, phone | 2.5 s | Timing |
| TTFB | 0.8 s | Timing |
| JavaScript, compressed | 300 KB | Size |
| Images above the fold | 200 KB | Size |
| Third party requests | 10 | Count |
| Lighthouse Performance | 90 | Score |
These numbers are an example; set yours from today's values with some room. Alert in two steps: a warning when a number gets within 10% of its budget, and a failure when it crosses. Lighthouse CI can enforce budgets on every pull request, so a heavy change fails before it merges.
Catching a Regression After a Release
Most slowdowns arrive with a deploy. Treat each release as a test:
- Before: run lab tests on one page of each changed template and keep the results.
- After: run the same tests with the same settings. Compare the median of several runs, not one run against one run.
- Check the server: response time on the key pages; a cold cache after a deploy can look like a regression for an hour.
- Watch the field: the weekly reading starts to move after about a week.
- Write the release date next to the trend, so a turn three weeks later can be traced.
| After the release | Lab | Field |
|---|---|---|
| 1 hour | ✓ | – |
| 1 day | ✓ | – |
| 1 week | ✓ | ◐ |
| 4 weeks | ✓ | ✓ |
If a regression is real, roll back or fix it before the field window fills with slow visits. SEO ProCheck's guide to server response time optimization covers the server side fixes.
Speed Across a Whole Site: Our Own Numbers
Testing a few templates is quick. Watching speed across every page takes a crawl. We found this on our own site: Neova's full crawl of seoprocheck.com on October 17, 2026 fetched 10,222 URLs in 61 minutes, about 2.8 URLs a second at a polite speed.
| seoprocheck.com, Oct 17, 2026 | Value |
|---|---|
| URLs fetched | 10,222 |
| HTML pages answering 200 | 4,561 |
| Crawl time | 61 min |
| Page bodies, raw | 1.66 GB |
That is why monitoring splits the work: a full crawl monthly or weekly for slow pages anywhere on the site, and a short list of key pages daily. A response time spread across thousands of pages also shows what a single test hides: one slow section among fast ones.
Page Speed Monitoring With Neova
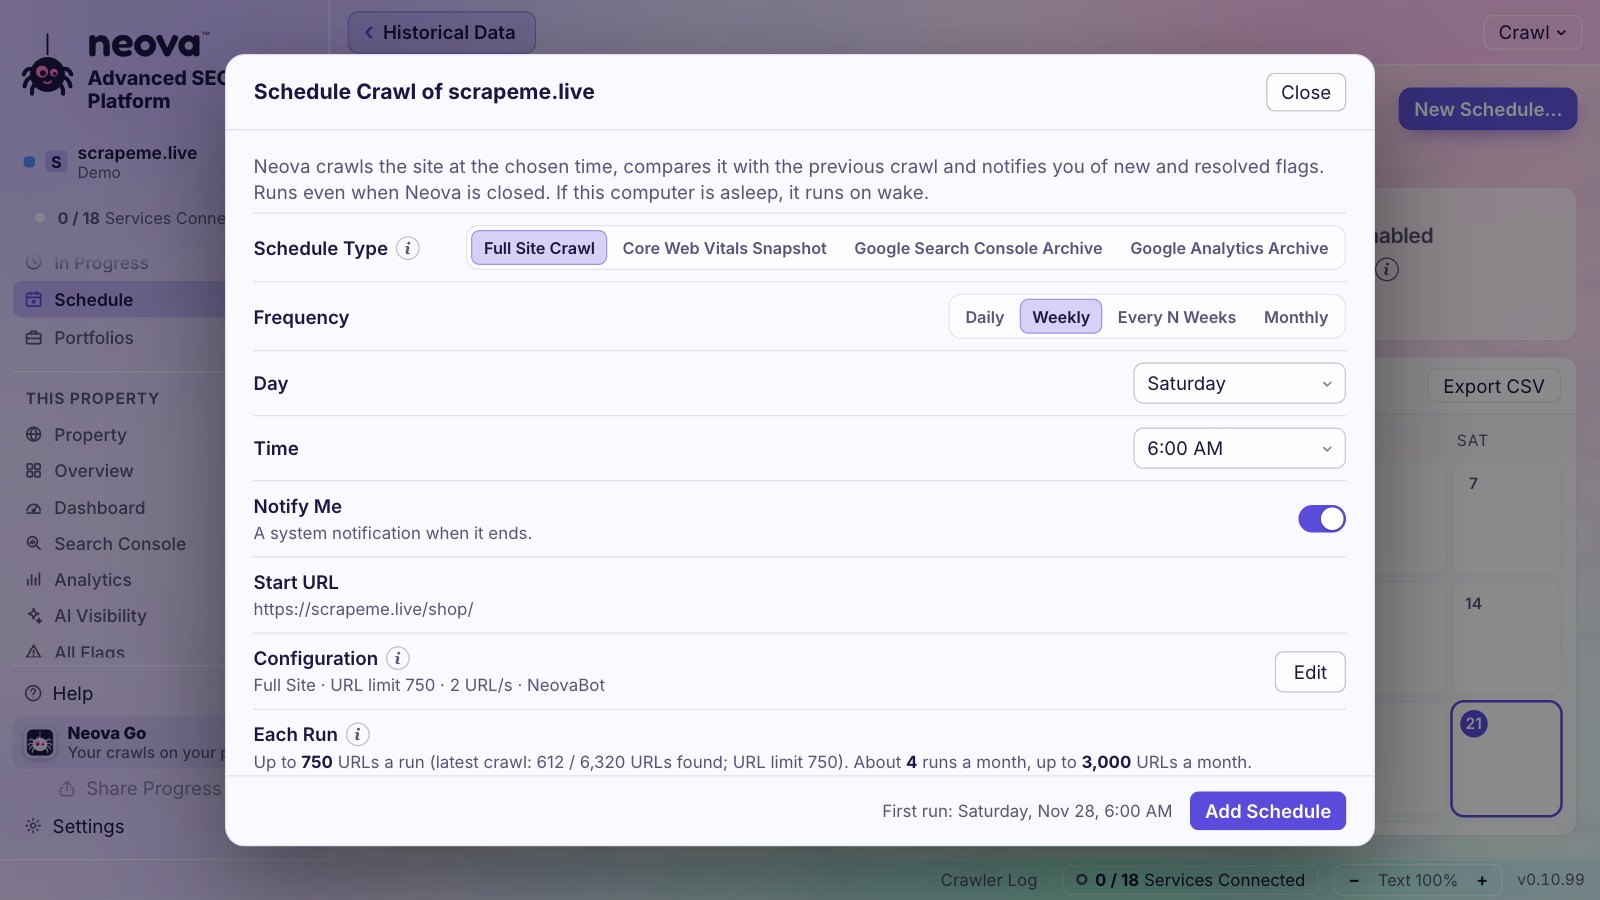
- Scheduled Crawls run Full Site Crawls Daily, Weekly, Every N Weeks or Monthly with the property's settings, with the window closed, and say what a schedule costs before you add it.
- Response Time Live shows the median, 9 in 10 and slowest response times while the crawl runs, with the 10 slowest pages.
- Lighthouse per Page Group runs Lighthouse lab checks on one HTML page per page group during the crawl, switched on in New Crawl.
- Core Web Vitals Snapshots read real-user data with your own Chrome UX Report key on a schedule, daily by default, or weekly or monthly, with a 40-week trend from the first day.
- Alert Rules raise alerts when Core Web Vitals change grade and when a new crawl has new flags.
Alerts arrive as system notifications, in Neova Go on your phone and in Slack or Microsoft Teams. A pet, if you chose one under Settings, Appearance, Pets, speaks up about crawl events like a scheduled crawl starting or a crawl's end with its Must Fix checks.
Speed checks among the 44 Performance checks:
- Server Response Time Is Slow in Lab or Field Data
- Slow Server Response Can Limit Crawl Rate
- Network Payload Is Over the Lighthouse Passing Line
- Text Compression Is Not Enabled
- Static Resource Has No Cache Lifetime or One Under 30 Days
- Main-Thread Work Is Over 2 Seconds
- JavaScript Rendering Takes Over 4 Seconds
The Schedule and Monitoring help page covers the setup. Every one of the 694 checks runs on the Free plan, up to 1,000 URLs a crawl.
Questions
What is page speed monitoring?
Measuring the same pages with the same settings on a schedule, keeping every result as a trend, and acting when a number crosses a threshold you set in advance.
Which page speed numbers should I monitor?
LCP, INP and CLS from field data for what Google uses, TTFB as an early warning from the server, and lab page weight and main thread time to catch heavier code before users feel it.
How often should I test page speed?
Lab tests on key templates with each release, server response on key pages daily, field Core Web Vitals weekly, and a full crawl with speed checks monthly.
Why does my speed score change when nothing changed?
Lab tests vary with network, hardware, other processes and changing ads or scripts. Run several times and compare medians, from the same place and device profile.
What is a performance budget?
A limit agreed in advance, per template, that a release may not cross: a timing such as LCP 2.5 s, a size such as 300 KB of JavaScript, or a score.